Written 02-Jun-2025 08:55:52 by Lars Baad-Jensen
Zabbix is a powerful monitoring tool – but when it comes to reporting, the story changes. The standard features rarely meet real-world needs, and customization options are limited. In short, Zabbix lacks flexibility and functionality in its reporting capabilities.
That’s why we’ve built our own reporting solution for Zabbix. In this article, we’ll explain how the solution is structured (yes, it gets a bit technical) and what reporting capabilities it can offer you.
A Reporting Solution That Actually Works
We – and our customers – have long needed a reporting platform that delivers real value. A flexible, visual, and practical solution that draws directly from Zabbix data to provide insight, not just information.
Over the years, we’ve tested various tools like JasperReports, Power BI, custom PHP scripts, and open-source GitHub projects. But none of them met the standards we – and our customers – require for a truly usable reporting solution.
So, we took matters into our own hands and developed a working solution based on Oracle APEX – a powerful and free development framework.
Key Benefits of Our Solution
Our Zabbix reporting solution offers several clear advantages, including:
- Standardized reports, tailored to your needs
- Visual, easy-to-read formats – ideal for both internal use and customer-facing documentation
- Full flexibility – you choose what data to include and how it’s displayed
- Available as a SaaS solution or hosted on-prem
- Built on your existing Zabbix data – no extra licenses or complex setup required
A Solid Technical Foundation
The solution is built using proven technologies and components:
- Oracle XE database (free up to 12 GB)
- Oracle Linux 9 (free, but support can be purchased)
- Oracle APEX (free development framework)
- Database link to your Zabbix backend (PostgreSQL)
Everything runs internally on a virtual machine with 4 CPUs, 16 GB RAM, and 80 GB disk space – more than sufficient for both development and operation. We’ve also configured:
- Database links
- Separate schemas for test and production
- Tablespace adjustments as needed
How It Works in Practice
Here’s how the reporting flow is structured:
- Zabbix data is fetched via a database link
- Data is stored and structured in Oracle tables
- Regular updates are managed by DBMS_SCHEDULER
- APEX is used to design and display the reports
- A plugin enables professional PDF export
You can choose from:
- Predefined reports (OS, database, network, etc.)
- Custom reports – e.g., CPU trends, disk usage, network spikes
- Full flexibility – you control both content and presentation
Gain Clarity and Take Control
Our reports help provide an objective overview of your system’s status (OS, database, etc.), complete with comments for each section. Typical sections include:
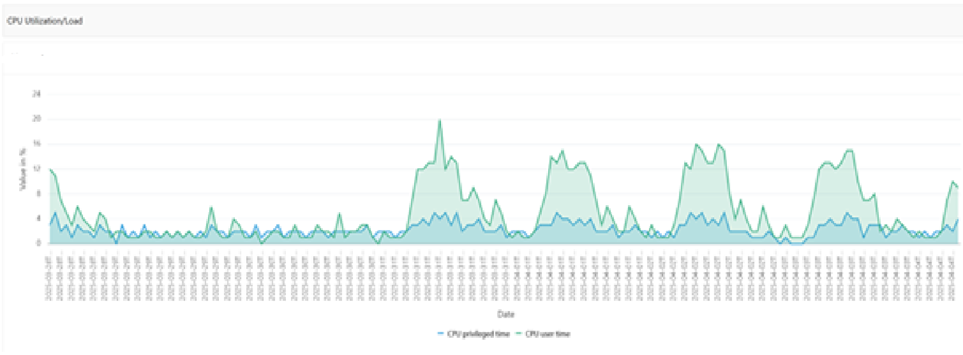
- CPU usage
- Disk usage
- Memory usage
- Network traffic
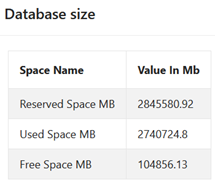
- Database size
...and anything else you monitor with Zabbix.
These reports make it easy to track trends over time, document performance for customers or management, and act proactively – before issues arise.
All Zabbix data is accessible and can be used to build meaningful, visual reports that are easy to store and share.
Examples
Summary of some of the graphs and tables available in the report generated from Zabbix data.
Image 1: Table of disk info
Image 2: Table of database size
Image 3: Table of invalid objects from Oracle database
Image 4: Graph showing CPU utilization over the last 7 days
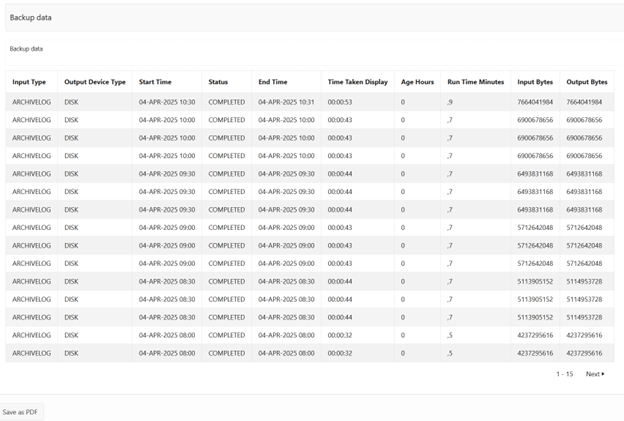
Image 5: Table of backup status from Oracle archivelog


.png) Lars Baad-Jensen
Lars Baad-Jensen